

SUKAN BEKALAN AIR SARAWAK (SBAS) 2025, KUCHING
DAY 4
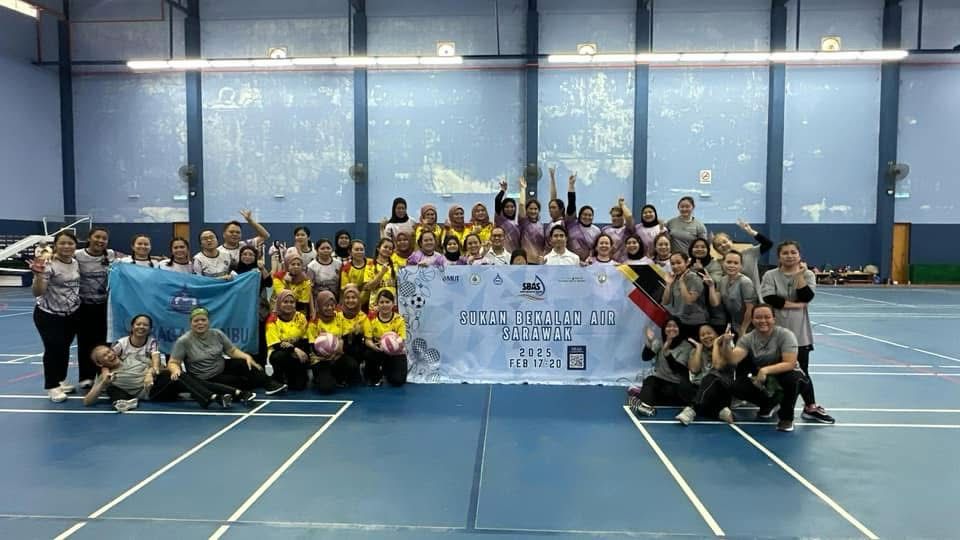
DAY 4
Kuching Water Board was established on the 1st January 1959, by authority of the Kuching Water Board Order 1959, Notification No. S.12 of 1959, made under Section 2 and 3 of the Water Supply Ordinance to take over the Kuching Water Supply from the Public Works Department Sarawak. On 1st June 1995, the existing Water Supply Ordinance (Sarawak Cap. 141) was repealed and replaced by the Water Ordinance 1994. On 1st January 2001, the Board was re-established under the Kuching Water Board, 2001.
Learn MorePress Release, 14 April 2025
Julaihi fields questions from the media. – Photo by Roystein Emmor KUCHING (April 13): Sarawak’s single water management entity is set to be launched in June this year, said Utility and Telecommunication Minister Dato Sri Julaihi Narawi today. He revealed the merger of Kuching Water Board, Sibu Water Board, and LAKU Management Sdn Bhd into this new entity is now in its final stage. He also said that the Rural Water Supply Department (JBALB), however, is not involved in the merger. “We already have a name for this entity. It will be officially launched in June. We are now in the final stage, meaning the three water agencies will be merged into a single entity. Except for JBALB – not yet (involving) JBALB,” he said to reporters at his Ministry’s Aidilfitri open house today. He was asked about the progress of the merger of the three water agencies, aimed at enhancing the efficiency of water supply management throughout Sarawak. It was reported in January that the new entity, approved by the Sarawak Cabinet last year, would begin operations in the second quarter of this year. Meanwhile, Premier Datuk Patinggi Tan Sri Abang Johari Tun Openg was among those visiting the Ministry of Utility and Telecommunication (MUT) Aidilfitri open house at Borneo Convention Centre Kuching (BCCK). Also present were Deputy Premier Datuk Amar Dr Sim Kui Hian, State Secretary Datuk Amar Mohamad Abu Bakar Marzuki, elected representatives and senior government officials. The event also included the handing over of contributions to the Sarawak Orphans Welfare Board (Peryatim) and children from the Laila Taib Welfare Complex. Julaihi was also surprised with a birthday cake in celebration of his 70th birthday.
Press Release, 08 April 2025
Photo shows the spot where KWB sets out to undertake critical repair works on a main water pipe at Jalan Premat KUCHING (April 8): Residential and commercial customers in the Petra Jaya, Demak Laut and Bako areas may experience low water pressure as the Kuching Water Board (KWB) sets out to undertake critical repair works on the main water pipe at Jalan Premat. In a press statement yesterday, the board confirmed that a site assessment was being conducted in collaboration with an appointed contractor. “The inspection targeted an 800mm nominal diameter ductile iron (ND DI) pipe, and a concrete block had been installed directly above the pipeline as a protective structure. “To address this issue, KWB sets out to isolate the affected main pipe starting at 10am tomorrow (April 8). “This measure is necessary to facilitate excavation and preliminary repair works, with efforts being made to minimise disruption to water supply services to the customers,” it added. According to KWB, the leak is spotted within the road median at Jalan Premat, and repair operations will involve the deployment of heavy machinery. “As such, the safety of road users is a major concern during the course of the works,” it stated. “We urge motorists and pedestrians in the area to remain vigilant and adhere to all posted traffic advisories and signages. “We appreciate the understanding and cooperation from the public as we carry out these critical repair works to maintain service reliability,” said KWB. The board also reassured consumers that updates would be provided throughout the progress of the works. “Members of the public can follow KWB’s official channels for the latest developments,” it reminded.
Press Release, 13 February 2025
Acara Kuching Cari Cari Water Edition anjuran Lembaga Air Kuching (LAK) kembali dengan menampilkan konsep pencarian harta karun pada 16 Februari ini. Kuching Cari Cari Water Edition tampil dengan pencarian harta karun By Douglas Elliot KUCHING, 13 Feb: Acara Kuching Cari Cari Water Edition anjuran Lembaga Air Kuching (LAK) kembali dengan menampilkan konsep pencarian harta karun pada 16 Februari ini. LAK dalam kenyataan hari ini menjelaskan, ia bertujuan melibatkan komuniti dalam aktiviti santai dan interaktif dan menekankan kepentingan infrastruktur serta usaha berterusan LAK dalam memastikan sumber air disalurkan ke setiap kediaman. “Acara pencarian harta karun ini akan bermula dan berakhir di Ibu Pejabat LAK di Batu Lintang dengan peserta akan menjelajah beberapa lokasi air utama di Sarawak termasuk Loji Rawatan Air Matang dan Loji Rawatan Air Batu Kitang. “Laluan mencabar ini bukan sahaja menawarkan pengalaman yang menyeronokkan kepada peserta malah memberi peluang untuk menghargai peranan penting kemudahan pengurusan air dalam memastikan bekalan air bersih yang berterusan,” menurut kenyataan tersebut. Menurut kenyataan tersebut, acara berkenaan turut menekankan kepentingan kerjasama berpasukan, strategi dan semangat komuniti sambil meraikan kepentingan air dalam kehidupan seharian. Sebanyak 50 pasukan akan bertanding dalam acara perburuan harta karun itu bagi merebut mahkota kejuaraan sekali gus membawa pulang wang tunai RM1,000.-TVS
Press Release, 21 February 2025
KUCHING: The Ministry of Utility and Telecommunication (MUT) has expressed its appreciation for the Federal Government’s approval, allowing the Sarawak Government to implement water infrastructure projects valued at less than RM50 million. Its Minister Dato Sri Julaihi Narawi remarked that the Federal Government's decision would enable Sarawak to expedite these vital water projects, complementing the state’s ongoing efforts, particularly in rural areas. "I understand that a recent approval for 2025 allows the Sarawak Government, through the Department of Rural Water Supply (JBALB), to execute water-related projects valued below RM50 million, which have been sanctioned by the Federal Government through the Ministry of Rural and Regional Development (KKDW)," he said. Speaking at the closing ceremony of the Sarawak Water Supply Sports (SBAS) at a local hotel on Thursday, Dato Sri Julaihi expressed his hope that this initiative would further support the Sarawak Government’s ongoing efforts in water supply development. "This approach should also help address delays in Federal Government project implementation, ensuring that Sarawakian residents, particularly those in rural areas, receive clean and uninterrupted water supply," he added. Dato Sri Julaihi further highlighted the Sarawak Government's intensified efforts to improve water supply access in rural areas, citing the implementation of two master plans with a combined allocation of RM4.6 billion. "In terms of financial commitment, the Sarawak Government has approved a substantial allocation for the Sarawak Water Master Plan and the Drip Water System across the state. Through alternative financing and allocations under the 12th Malaysia Plan (12MP), RM4.6 billion has been earmarked for 407 projects to date. Of these, 289 projects, representing 71 per cent, have been completed, while 79 projects (19.4 per cent) are in the pre-contract stage, with the remainder at various stages of implementation," he explained. The Minister also noted that the Sarawak Government has successfully achieved 85 per cent clean water supply coverage across the region, including rural areas. Among those present at the event were Permanent Secretary of MUT, Datu Jafri Lias, Deputy Permanent Secretary of MUT, Syed Fauzi, Director of JBALB Sarawak, Ir Ts Awang Mohammad Fadillah Awang Redzuan, General Manager of the Kuching Water Board, Ir Rodziah Mohamad, General Manager of the Sibu Water Board, Abdul Malik, and Chief Executive Officer of Sarawak Water Sdn Bhd, Ir Ts Daniel Punang, along with other distinguished guests. -UKASnews
Press Release, 21 February 2025
Dato Sri Julaihi Narawi (tengah) pada Majlis Jalinan Mesra di Kuching, malam tadi. Foto Julaihi Narawi (FB) KUCHING, 21 Feb: Kerajaan Sarawak komited menyediakan bekalan air bersih dan mencukupi ke seluruh negeri menjelang tahun 2030 menerusi pelaksanaan Pelan Induk Bekalan Air Sarawak dan Sistem Grid Bekalan Air Sarawak. Menteri Utiliti dan Telekomunikasi, Dato Sri Julaihi Narawi, berkata pelan induk ini bertujuan memastikan setiap kawasan, terutama luar bandar, mendapat bekalan air yang mencukupi. Menurutnya, sistem grid air yang sedang dilaksanakan berupaya menghubungkan pelbagai kawasan di Sarawak bagi meningkatkan kecekapan pengagihan air. “Pelbagai usaha dan peruntukan besar telah dan akan terus diluluskan bagi meningkatkan infrastruktur bekalan air, sekali gus memastikan komitmen Kerajaan Sarawak dalam memberikan perkhidmatan bekalan air terbaik kepada rakyat di negeri ini. “Setakat ini, sebanyak RM4.6 bilion telah diperuntukkan oleh Kerajan Sarawak di bawah pembiayaan alternatif dan Rancangan Malaysia ke-12 (RMK12) bagi pelaksanaan 407 bekalan air, iaitu 289 projek yang telah siap, manakala 79 projek sedang berada dalam peringkat prakontrak dan pelaksanaan,” katanya. Beliau berkata demikian ketika berucap pada Majlis Malam Jalinan Mesra di sini, malam tadi. Menurutnya, Kerajaan Sarawak turut memperuntukkan RM1.1 bilion bagi menggantikan dan menaik taraf sistem paip lama sepanjang 2,470 kilometer di seluruh Sarawak dalam tempoh lima tahun. “Tahun lalu, RM247 juta telah diluluskan, menjadikan jumlah keseluruhan peruntukan hampir RM500 juta,” jelasnya. Dalam pada itu, Julaihi turut menegaskan bahawa Kerajaan Sarawak dan Kerajaan Persekutuan juga perlu bekerjasama untuk memastikan kelancaran projek bekalan air. “Setakat ini, beberapa projek yang diluluskan oleh Kerajaan Persekutuan sejak tahun 2016 mengalami kelewatan dalam pelaksanaan. “Justeru, Kerajaan Sarawak berharap agar Jabatan Bekalan Air Luar Bandar Sarawak diberi kuasa penuh untuk melaksanakan projek bernilai RM50 juta dan ke bawah,” ujarnya. Beliau menegaskan bahawa usaha ini adalah sebahagian daripada strategi Sarawak untuk memastikan bekalan air di negeri ini mencukupi dan berdaya tahan dalam jangka masa panjang. “Kami yakin bahawa dengan pelaksanaan projek-projek ini secara menyeluruh dan berterusan, rakyat Sarawak, tanpa mengira lokasi mereka, akan mendapat bekalan air yang stabil dan berkualiti,” jelasnya.
Press Release, 17 April 2025
Photo for illustration purposes only. KUCHING (April 16): Consumers in Matang and Petra Jaya will experience water disruption starting at 10pm this Friday due to repair work on a damaged 1400mm diameter MSCL pipe at Jalan Highfield Light Industrial-Jalan Batu Kawa. A notice from Kuching Water Board (KWB) stated that the affected areas include Kubah Ria to Mile 9 Jalan Matang, Taman Sri Harmoni, Jalan Sungai Tengah, Jalan Tun Abdul Rahman Yakub, Jalan Tun Datuk Patinggi Abang Haji Muhammad Salahuddin, Jalan Demak, Jalan Bako and Muara Tebas. Surrounding areas in Petra Jaya, including those under the jurisdiction of Rural Water Supply Department (JBALB), will also be affected. According to KWB, the repair work is scheduled to be completed by 7am on Saturday. “Consumers will experience low water pressure or no water supply. During the recovery period, consumers may experience low pressure, airlocks, and discoloured or dirty water,” the notice said. It strongly advised consumers to store sufficient water in advance for the duration of the supply interruption. “KWB water tankers will be mobilised to provide alternative water access during this period. “We sincerely apologise for the inconvenience and thank you for your patience and understanding during this time,” the notice added.
Press Release, 16 April 2025
KUCHING: The Sarawak Government is now in the final phase of merging the three water utility agencies – Kuching Water Board (KWB), Sibu Water Board (SWB), and LAKU Management Sdn. Bhd. – into a single, more efficient and structured entity. Sarawak’s Minister for Utility and Telecommunications, Dato Sri Julaihi Narawi, said the merger is one of the State Government’s strategic moves to streamline water supply management and enhance service delivery efficiency for the people across Sarawak. “This consolidation process is now nearing completion and is expected to be officially launched by this coming June. “The name of the new entity has also been finalised,” he said this when met at the 2025 Hari Raya Aidilfitri Open House hosted by the Ministry of Utility and Telecommunication along with its agencies, held at the Borneo Convention Centre Kuching (BCCK) on Sunday. However, he clarified that the Rural Water Supply Department (JBALB) is not yet part of this consolidation exercise. This initiative is in line with the Sarawak Government’s goal of establishing a more efficient water supply system, particularly to ensure consistent and quality services for residents in both urban and rural areas. In a related development, Dato Sri Julaihi also revealed that the Sarawak Government now holds a majority stake in SACOFA Sdn. Bhd. through its wholly owned investment arm, SFS Incorporated. With a shareholding of over 51 per cent, SACOFA is now a fully state-owned agency, enabling the company to take on a greater role in expanding telecommunications infrastructure, especially in rural and remote areas. The event was graced by the presence of Sarawak Premier, Datuk Patinggi Tan Sri (Dr) Abang Abdul Rahman Zohari Tun Datuk Abang Openg, accompanied by his wife, Datuk Amar Juma’ani Tun Tuanku Bujang, as well as members of the state cabinet and other honoured guests. - UKASnews
Press Release, 16 April 2025
Datuk Patinggi Tan Sri Abang Johari Tun Openg dan Dato Sri Julaihi Narawi pada Majlis Rumah Terbuka Aidilfitri Kementerian Utiliti dan Telekomunikasi Sarawak Bersama Agensi Tahun 2025 di Kuching, hari ini. Foto Nadim Bokhari (TVS) KUCHING, 13 April: Kerajaan Sarawak kini berada pada fasa akhir proses penggabungan tiga agensi utiliti bekalan air iaitu Lembaga Air Kuching (KWB), Lembaga Air Sibu (SWB) dan Lembaga Air Kawasan Utara (LAKU) sekali gus menjadi satu entiti tunggal yang lebih cekap dan tersusun, lapor Unit Komunikasi Awam Sarawak (UKAS). Laporan itu memetik Menteri Utiliti dan Telekomunikasi Sarawak, Dato Sri Julaihi Narawi sebagai berkata, usaha penggabungan tersebut merupakan antara langkah strategik Kerajaan Sarawak dalam memperkemas pengurusan bekalan air serta meningkatkan kecekapan penyampaian perkhidmatan kepada rakyat di seluruh negeri. “Proses penyatuan ini kini hampir selesai dan dijangka dilancarkan secara rasmi menjelang Jun akan datang. “Nama entiti baharu juga telah ditetapkan,” katanya ketika ditemui pada Majlis Rumah Terbuka Aidilfitri Kementerian Utiliti dan Telekomunikasi Sarawak Bersama Agensi Tahun 2025 di Pusat Konvensyen Borneo Kuching (BCCK) di sini, hari ini. Bagaimanapun, beliau menjelaskan bahawa Jabatan Bekalan Air Luar Bandar (JBALB) belum terlibat dalam penyatuan tersebut buat masa ini. Langkah itu adalah selaras dengan matlamat Kerajaan Sarawak untuk menyediakan sistem bekalan air yang lebih efisien, khususnya bagi memastikan rakyat di kawasan bandar dan luar bandar menerima perkhidmatan yang seragam dan berkualiti. Dalam perkembangan berkaitan, Julaihi turut memaklumkan bahawa Kerajaan Sarawak kini memegang kepentingan majoriti dalam SACOFA Sdn. Bhd. melalui syarikat pelaburan milik penuh kerajaan negeri, SFS Incorporated. Dengan pegangan melebihi 51 peratus, SACOFA kini merupakan agensi milik penuh kerajaan negeri, yang membolehkan syarikat tersebut memainkan peranan lebih besar dalam memperluas liputan infrastruktur telekomunikasi, terutamanya di kawasan luar bandar dan pedalaman. Majlis berkenaan diserikan dengan kehadiran Premier Sarawak, Datuk Patinggi Tan Sri Abang Johari Tun Openg serta isteri, Datuk Amar Juma’ani Tun Tuanku Bujang, serta barisan menteri kabinet negeri dan tetamu kehormat lain.
Press Release, 14 April 2025
Julaihi fields questions from the media. – Photo by Roystein Emmor KUCHING (April 13): Sarawak’s single water management entity is set to be launched in June this year, said Utility and Telecommunication Minister Dato Sri Julaihi Narawi today. He revealed the merger of Kuching Water Board, Sibu Water Board, and LAKU Management Sdn Bhd into this new entity is now in its final stage. He also said that the Rural Water Supply Department (JBALB), however, is not involved in the merger. “We already have a name for this entity. It will be officially launched in June. We are now in the final stage, meaning the three water agencies will be merged into a single entity. Except for JBALB – not yet (involving) JBALB,” he said to reporters at his Ministry’s Aidilfitri open house today. He was asked about the progress of the merger of the three water agencies, aimed at enhancing the efficiency of water supply management throughout Sarawak. It was reported in January that the new entity, approved by the Sarawak Cabinet last year, would begin operations in the second quarter of this year. Meanwhile, Premier Datuk Patinggi Tan Sri Abang Johari Tun Openg was among those visiting the Ministry of Utility and Telecommunication (MUT) Aidilfitri open house at Borneo Convention Centre Kuching (BCCK). Also present were Deputy Premier Datuk Amar Dr Sim Kui Hian, State Secretary Datuk Amar Mohamad Abu Bakar Marzuki, elected representatives and senior government officials. The event also included the handing over of contributions to the Sarawak Orphans Welfare Board (Peryatim) and children from the Laila Taib Welfare Complex. Julaihi was also surprised with a birthday cake in celebration of his 70th birthday.
Press Release, 08 April 2025
Photo shows the spot where KWB sets out to undertake critical repair works on a main water pipe at Jalan Premat KUCHING (April 8): Residential and commercial customers in the Petra Jaya, Demak Laut and Bako areas may experience low water pressure as the Kuching Water Board (KWB) sets out to undertake critical repair works on the main water pipe at Jalan Premat. In a press statement yesterday, the board confirmed that a site assessment was being conducted in collaboration with an appointed contractor. “The inspection targeted an 800mm nominal diameter ductile iron (ND DI) pipe, and a concrete block had been installed directly above the pipeline as a protective structure. “To address this issue, KWB sets out to isolate the affected main pipe starting at 10am tomorrow (April 8). “This measure is necessary to facilitate excavation and preliminary repair works, with efforts being made to minimise disruption to water supply services to the customers,” it added. According to KWB, the leak is spotted within the road median at Jalan Premat, and repair operations will involve the deployment of heavy machinery. “As such, the safety of road users is a major concern during the course of the works,” it stated. “We urge motorists and pedestrians in the area to remain vigilant and adhere to all posted traffic advisories and signages. “We appreciate the understanding and cooperation from the public as we carry out these critical repair works to maintain service reliability,” said KWB. The board also reassured consumers that updates would be provided throughout the progress of the works. “Members of the public can follow KWB’s official channels for the latest developments,” it reminded.
Press Release, 13 February 2025
Acara Kuching Cari Cari Water Edition anjuran Lembaga Air Kuching (LAK) kembali dengan menampilkan konsep pencarian harta karun pada 16 Februari ini. Kuching Cari Cari Water Edition tampil dengan pencarian harta karun By Douglas Elliot KUCHING, 13 Feb: Acara Kuching Cari Cari Water Edition anjuran Lembaga Air Kuching (LAK) kembali dengan menampilkan konsep pencarian harta karun pada 16 Februari ini. LAK dalam kenyataan hari ini menjelaskan, ia bertujuan melibatkan komuniti dalam aktiviti santai dan interaktif dan menekankan kepentingan infrastruktur serta usaha berterusan LAK dalam memastikan sumber air disalurkan ke setiap kediaman. “Acara pencarian harta karun ini akan bermula dan berakhir di Ibu Pejabat LAK di Batu Lintang dengan peserta akan menjelajah beberapa lokasi air utama di Sarawak termasuk Loji Rawatan Air Matang dan Loji Rawatan Air Batu Kitang. “Laluan mencabar ini bukan sahaja menawarkan pengalaman yang menyeronokkan kepada peserta malah memberi peluang untuk menghargai peranan penting kemudahan pengurusan air dalam memastikan bekalan air bersih yang berterusan,” menurut kenyataan tersebut. Menurut kenyataan tersebut, acara berkenaan turut menekankan kepentingan kerjasama berpasukan, strategi dan semangat komuniti sambil meraikan kepentingan air dalam kehidupan seharian. Sebanyak 50 pasukan akan bertanding dalam acara perburuan harta karun itu bagi merebut mahkota kejuaraan sekali gus membawa pulang wang tunai RM1,000.-TVS
Press Release, 21 February 2025
KUCHING: The Ministry of Utility and Telecommunication (MUT) has expressed its appreciation for the Federal Government’s approval, allowing the Sarawak Government to implement water infrastructure projects valued at less than RM50 million. Its Minister Dato Sri Julaihi Narawi remarked that the Federal Government's decision would enable Sarawak to expedite these vital water projects, complementing the state’s ongoing efforts, particularly in rural areas. "I understand that a recent approval for 2025 allows the Sarawak Government, through the Department of Rural Water Supply (JBALB), to execute water-related projects valued below RM50 million, which have been sanctioned by the Federal Government through the Ministry of Rural and Regional Development (KKDW)," he said. Speaking at the closing ceremony of the Sarawak Water Supply Sports (SBAS) at a local hotel on Thursday, Dato Sri Julaihi expressed his hope that this initiative would further support the Sarawak Government’s ongoing efforts in water supply development. "This approach should also help address delays in Federal Government project implementation, ensuring that Sarawakian residents, particularly those in rural areas, receive clean and uninterrupted water supply," he added. Dato Sri Julaihi further highlighted the Sarawak Government's intensified efforts to improve water supply access in rural areas, citing the implementation of two master plans with a combined allocation of RM4.6 billion. "In terms of financial commitment, the Sarawak Government has approved a substantial allocation for the Sarawak Water Master Plan and the Drip Water System across the state. Through alternative financing and allocations under the 12th Malaysia Plan (12MP), RM4.6 billion has been earmarked for 407 projects to date. Of these, 289 projects, representing 71 per cent, have been completed, while 79 projects (19.4 per cent) are in the pre-contract stage, with the remainder at various stages of implementation," he explained. The Minister also noted that the Sarawak Government has successfully achieved 85 per cent clean water supply coverage across the region, including rural areas. Among those present at the event were Permanent Secretary of MUT, Datu Jafri Lias, Deputy Permanent Secretary of MUT, Syed Fauzi, Director of JBALB Sarawak, Ir Ts Awang Mohammad Fadillah Awang Redzuan, General Manager of the Kuching Water Board, Ir Rodziah Mohamad, General Manager of the Sibu Water Board, Abdul Malik, and Chief Executive Officer of Sarawak Water Sdn Bhd, Ir Ts Daniel Punang, along with other distinguished guests. -UKASnews
Press Release, 21 February 2025
Dato Sri Julaihi Narawi (tengah) pada Majlis Jalinan Mesra di Kuching, malam tadi. Foto Julaihi Narawi (FB) KUCHING, 21 Feb: Kerajaan Sarawak komited menyediakan bekalan air bersih dan mencukupi ke seluruh negeri menjelang tahun 2030 menerusi pelaksanaan Pelan Induk Bekalan Air Sarawak dan Sistem Grid Bekalan Air Sarawak. Menteri Utiliti dan Telekomunikasi, Dato Sri Julaihi Narawi, berkata pelan induk ini bertujuan memastikan setiap kawasan, terutama luar bandar, mendapat bekalan air yang mencukupi. Menurutnya, sistem grid air yang sedang dilaksanakan berupaya menghubungkan pelbagai kawasan di Sarawak bagi meningkatkan kecekapan pengagihan air. “Pelbagai usaha dan peruntukan besar telah dan akan terus diluluskan bagi meningkatkan infrastruktur bekalan air, sekali gus memastikan komitmen Kerajaan Sarawak dalam memberikan perkhidmatan bekalan air terbaik kepada rakyat di negeri ini. “Setakat ini, sebanyak RM4.6 bilion telah diperuntukkan oleh Kerajan Sarawak di bawah pembiayaan alternatif dan Rancangan Malaysia ke-12 (RMK12) bagi pelaksanaan 407 bekalan air, iaitu 289 projek yang telah siap, manakala 79 projek sedang berada dalam peringkat prakontrak dan pelaksanaan,” katanya. Beliau berkata demikian ketika berucap pada Majlis Malam Jalinan Mesra di sini, malam tadi. Menurutnya, Kerajaan Sarawak turut memperuntukkan RM1.1 bilion bagi menggantikan dan menaik taraf sistem paip lama sepanjang 2,470 kilometer di seluruh Sarawak dalam tempoh lima tahun. “Tahun lalu, RM247 juta telah diluluskan, menjadikan jumlah keseluruhan peruntukan hampir RM500 juta,” jelasnya. Dalam pada itu, Julaihi turut menegaskan bahawa Kerajaan Sarawak dan Kerajaan Persekutuan juga perlu bekerjasama untuk memastikan kelancaran projek bekalan air. “Setakat ini, beberapa projek yang diluluskan oleh Kerajaan Persekutuan sejak tahun 2016 mengalami kelewatan dalam pelaksanaan. “Justeru, Kerajaan Sarawak berharap agar Jabatan Bekalan Air Luar Bandar Sarawak diberi kuasa penuh untuk melaksanakan projek bernilai RM50 juta dan ke bawah,” ujarnya. Beliau menegaskan bahawa usaha ini adalah sebahagian daripada strategi Sarawak untuk memastikan bekalan air di negeri ini mencukupi dan berdaya tahan dalam jangka masa panjang. “Kami yakin bahawa dengan pelaksanaan projek-projek ini secara menyeluruh dan berterusan, rakyat Sarawak, tanpa mengira lokasi mereka, akan mendapat bekalan air yang stabil dan berkualiti,” jelasnya.
Press Release, 17 April 2025
Photo for illustration purposes only. KUCHING (April 16): Consumers in Matang and Petra Jaya will experience water disruption starting at 10pm this Friday due to repair work on a damaged 1400mm diameter MSCL pipe at Jalan Highfield Light Industrial-Jalan Batu Kawa. A notice from Kuching Water Board (KWB) stated that the affected areas include Kubah Ria to Mile 9 Jalan Matang, Taman Sri Harmoni, Jalan Sungai Tengah, Jalan Tun Abdul Rahman Yakub, Jalan Tun Datuk Patinggi Abang Haji Muhammad Salahuddin, Jalan Demak, Jalan Bako and Muara Tebas. Surrounding areas in Petra Jaya, including those under the jurisdiction of Rural Water Supply Department (JBALB), will also be affected. According to KWB, the repair work is scheduled to be completed by 7am on Saturday. “Consumers will experience low water pressure or no water supply. During the recovery period, consumers may experience low pressure, airlocks, and discoloured or dirty water,” the notice said. It strongly advised consumers to store sufficient water in advance for the duration of the supply interruption. “KWB water tankers will be mobilised to provide alternative water access during this period. “We sincerely apologise for the inconvenience and thank you for your patience and understanding during this time,” the notice added.
Press Release, 16 April 2025
KUCHING: The Sarawak Government is now in the final phase of merging the three water utility agencies – Kuching Water Board (KWB), Sibu Water Board (SWB), and LAKU Management Sdn. Bhd. – into a single, more efficient and structured entity. Sarawak’s Minister for Utility and Telecommunications, Dato Sri Julaihi Narawi, said the merger is one of the State Government’s strategic moves to streamline water supply management and enhance service delivery efficiency for the people across Sarawak. “This consolidation process is now nearing completion and is expected to be officially launched by this coming June. “The name of the new entity has also been finalised,” he said this when met at the 2025 Hari Raya Aidilfitri Open House hosted by the Ministry of Utility and Telecommunication along with its agencies, held at the Borneo Convention Centre Kuching (BCCK) on Sunday. However, he clarified that the Rural Water Supply Department (JBALB) is not yet part of this consolidation exercise. This initiative is in line with the Sarawak Government’s goal of establishing a more efficient water supply system, particularly to ensure consistent and quality services for residents in both urban and rural areas. In a related development, Dato Sri Julaihi also revealed that the Sarawak Government now holds a majority stake in SACOFA Sdn. Bhd. through its wholly owned investment arm, SFS Incorporated. With a shareholding of over 51 per cent, SACOFA is now a fully state-owned agency, enabling the company to take on a greater role in expanding telecommunications infrastructure, especially in rural and remote areas. The event was graced by the presence of Sarawak Premier, Datuk Patinggi Tan Sri (Dr) Abang Abdul Rahman Zohari Tun Datuk Abang Openg, accompanied by his wife, Datuk Amar Juma’ani Tun Tuanku Bujang, as well as members of the state cabinet and other honoured guests. - UKASnews
Press Release, 16 April 2025
Datuk Patinggi Tan Sri Abang Johari Tun Openg dan Dato Sri Julaihi Narawi pada Majlis Rumah Terbuka Aidilfitri Kementerian Utiliti dan Telekomunikasi Sarawak Bersama Agensi Tahun 2025 di Kuching, hari ini. Foto Nadim Bokhari (TVS) KUCHING, 13 April: Kerajaan Sarawak kini berada pada fasa akhir proses penggabungan tiga agensi utiliti bekalan air iaitu Lembaga Air Kuching (KWB), Lembaga Air Sibu (SWB) dan Lembaga Air Kawasan Utara (LAKU) sekali gus menjadi satu entiti tunggal yang lebih cekap dan tersusun, lapor Unit Komunikasi Awam Sarawak (UKAS). Laporan itu memetik Menteri Utiliti dan Telekomunikasi Sarawak, Dato Sri Julaihi Narawi sebagai berkata, usaha penggabungan tersebut merupakan antara langkah strategik Kerajaan Sarawak dalam memperkemas pengurusan bekalan air serta meningkatkan kecekapan penyampaian perkhidmatan kepada rakyat di seluruh negeri. “Proses penyatuan ini kini hampir selesai dan dijangka dilancarkan secara rasmi menjelang Jun akan datang. “Nama entiti baharu juga telah ditetapkan,” katanya ketika ditemui pada Majlis Rumah Terbuka Aidilfitri Kementerian Utiliti dan Telekomunikasi Sarawak Bersama Agensi Tahun 2025 di Pusat Konvensyen Borneo Kuching (BCCK) di sini, hari ini. Bagaimanapun, beliau menjelaskan bahawa Jabatan Bekalan Air Luar Bandar (JBALB) belum terlibat dalam penyatuan tersebut buat masa ini. Langkah itu adalah selaras dengan matlamat Kerajaan Sarawak untuk menyediakan sistem bekalan air yang lebih efisien, khususnya bagi memastikan rakyat di kawasan bandar dan luar bandar menerima perkhidmatan yang seragam dan berkualiti. Dalam perkembangan berkaitan, Julaihi turut memaklumkan bahawa Kerajaan Sarawak kini memegang kepentingan majoriti dalam SACOFA Sdn. Bhd. melalui syarikat pelaburan milik penuh kerajaan negeri, SFS Incorporated. Dengan pegangan melebihi 51 peratus, SACOFA kini merupakan agensi milik penuh kerajaan negeri, yang membolehkan syarikat tersebut memainkan peranan lebih besar dalam memperluas liputan infrastruktur telekomunikasi, terutamanya di kawasan luar bandar dan pedalaman. Majlis berkenaan diserikan dengan kehadiran Premier Sarawak, Datuk Patinggi Tan Sri Abang Johari Tun Openg serta isteri, Datuk Amar Juma’ani Tun Tuanku Bujang, serta barisan menteri kabinet negeri dan tetamu kehormat lain.
Press Release, 25 May 2025
Press Release, 13 May 2025
****************************************************************** NOTICE OF TENDER KWB/T/9/2025 Provision of Security Services for Kuching Water Board (Re-Tender) KWB/T/15/2025 Term Contract for the Supply, Delivery, Installation, Testing and Commissioning of Data Loggers for Online Monitoring System to Kuching Water Board. KWB/T/17/2025 Term Contract for the Replacement and Maintenance of Water Meter for Kuching Water Board.
Press Release, 05 May 2025
E-INVOICING UPDATE FOR WATER BILL Dear Value Consumers, As required by the Inland Revenue Board Malaysia (“IRBM”), it is mandatory for Kuching Water Board to implement e-invoicing in coming 1st July 2025. To comply with the stipulations set forth by the IRBM, please furnish us the following profile information, should you need e-invoice: Registered Name/ Business Name Tax Identification Number (issued by IRBM) Business Registration Number / Identification Number / Passport Number Sales & Services Tax Registration Number Email Address Registered Address/ Business Address Contact Number Sales Tax Exemption Certification Number / Special Exemption as per gazette orders (if applicable) Businesses failing to adopt e-invoicing may face fines, legal actions, tax losses, and market exclusion. We prioritise the confidentiality and security of your data and will ensure that it is handled with utmost care and in strict compliance with applicable laws and regulations. Please do not hesitate to email us at billing@kwb.gov.my should you require further clarification. Thank you for your cooperation and continuous support.
Press Release, 25 May 2025